
Social Media Usage Statistics Around the World
Animated charts covering global user counts, daily time spent per platform, generational differences, and where audience attention is shifting fastest.

An infographic video template gives you a structured starting point for turning numbers, findings, and comparisons into something people actually watch. Choose a template, upload your report or data summary, and Leadde builds animated scenes, narration, and captions you can edit.
9 video types
Showing 9 video types across 4 categories
Animated charts covering global user counts, daily time spent per platform, generational differences, and where audience attention is shifting fastest.

Turns yearly results into animated charts covering revenue growth, customer retention, headcount changes, market expansion, and priorities for the year ahead.

A data-driven breakdown of video marketing adoption, average watch rates, conversion lift by format, and channel-by-channel return on investment benchmarks.

Traces the game industry from arcade cabinets to cloud streaming, visualizing milestone dates, console generations, player numbers, and revenue growth.

Breaks down average daily screen time by age group, sleep impact findings, notification volume, and habits linked to healthier device use.
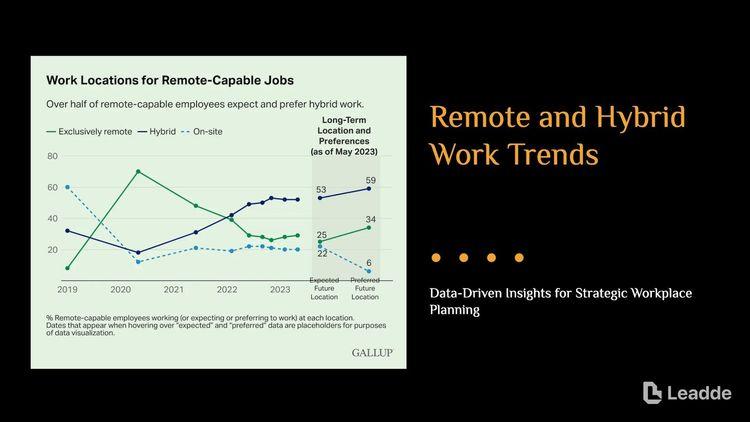
Visualizes remote work adoption rates, productivity findings, office attendance patterns, and what employees say they value most about schedule flexibility.

Charts the rise of solar, wind, and storage capacity, falling costs per kilowatt-hour, regional leaders, and the grid challenges that remain.

Presents survey participation rates, top-scoring themes, areas needing attention, and department comparisons through a clear animated chart sequence.

Visualizes cart abandonment rates, mobile versus desktop conversion, preferred payment methods, and the return rates behind online retail profit margins.

An informative video template gives you a structured starting point for answering one question completely, without asking the viewer to do anything afterwards. Choose a template, upload the notice, FAQ, or update you need to communicate, and Leadde drafts the scenes, narration, and subtitles.

A comparison video template gives you a structured starting point for weighing two options against the same criteria and letting the viewer reach the conclusion. Choose a template, upload your battlecard, spec sheet, or evaluation notes, and Leadde generates editable scenes, narration, subtitles, and visuals.

A product video template gives you a structured starting point for introducing what a product is, who it is for, and what makes it different. Choose a template, upload a spec sheet, catalogue entry, or product page, and Leadde generates editable scenes, narration, subtitles, and visuals.

A product explainer video template gives you a structured starting point for showing why a product exists before showing how it works. Choose a template, upload a release note, PRD, or help-center article, and Leadde turns it into editable scenes, narration, subtitles, and on-screen visuals.

A product promo video template gives you a structured starting point for a short campaign cut built around a launch date, an offer, or a season. Choose a template, upload your launch brief or offer terms, and Leadde generates editable scenes, narration, captions, and visuals.

A SaaS promo video template gives you a structured starting point for campaign videos whose only job is to get a visitor into a free trial. Choose a template, upload your website copy, comparison page, or customer results, and Leadde generates editable scenes, narration, and captions.

An educational video template gives you a structured starting point for teaching one topic to a class that will watch it outside the room. Choose a template, upload a lesson plan, textbook chapter, or slide deck, and Leadde generates editable scenes, narration, subtitles, and visuals.

An e-learning video template gives you a structured starting point for a course module with stated objectives, segmented content, and a checkpoint at the end. Choose a template, upload your syllabus or course outline, and Leadde generates editable scenes, narration, and subtitles.

An instructional video template gives you a structured starting point for teaching one procedure to someone who has to carry it out correctly. Choose a template, upload a user guide, setup sheet, or troubleshooting article, and Leadde generates editable scenes, narration, and subtitles.

A video presentation template gives you a structured starting point for delivering a talk that your audience watches instead of attends. Choose a template, upload your PowerPoint deck, PDF, or speaker notes, and Leadde turns each slide into a narrated, editable scene.

A training video template gives you a structured starting point for teaching a procedure or a system to people who have to get it right at work. Choose a template, upload your SOP, equipment manual, or rollout plan, and Leadde generates editable scenes, narration, and subtitles.

An onboarding video template gives you a structured starting point for walking a new hire or a new customer through their first week. Choose a template, upload your handbook, benefits PDF, or setup checklist, and Leadde generates editable scenes, narration, subtitles, and visuals.

A cyber security video template gives you a structured starting point for awareness training that employees remember when it matters. Choose a template, upload your security policy, phishing report, or incident summary, and Leadde generates editable scenes, narration, and subtitles.

A compliance video template gives you a structured starting point for communicating a policy or a regulatory change to people who then have to acknowledge it. Choose a template, upload your policy PDF or code of conduct, and Leadde generates editable scenes, narration, and subtitles.
An infographic video template is a reusable video framework for content and research teams whose most valuable material is data — a benchmark study, a survey, an annual report — and whose problem is that data-heavy documents get downloaded far more often than they get read.
The template decides how many figures appear per scene, in what order, and how each one is introduced before it appears. That sequencing matters more than the animation: a chart shown before the viewer knows what question it answers is a chart nobody reads. Leadde takes your source document, drafts narration that sets up each figure, generates the animated scenes and captions, and hands back a project where every number, label, and timing can be corrected.
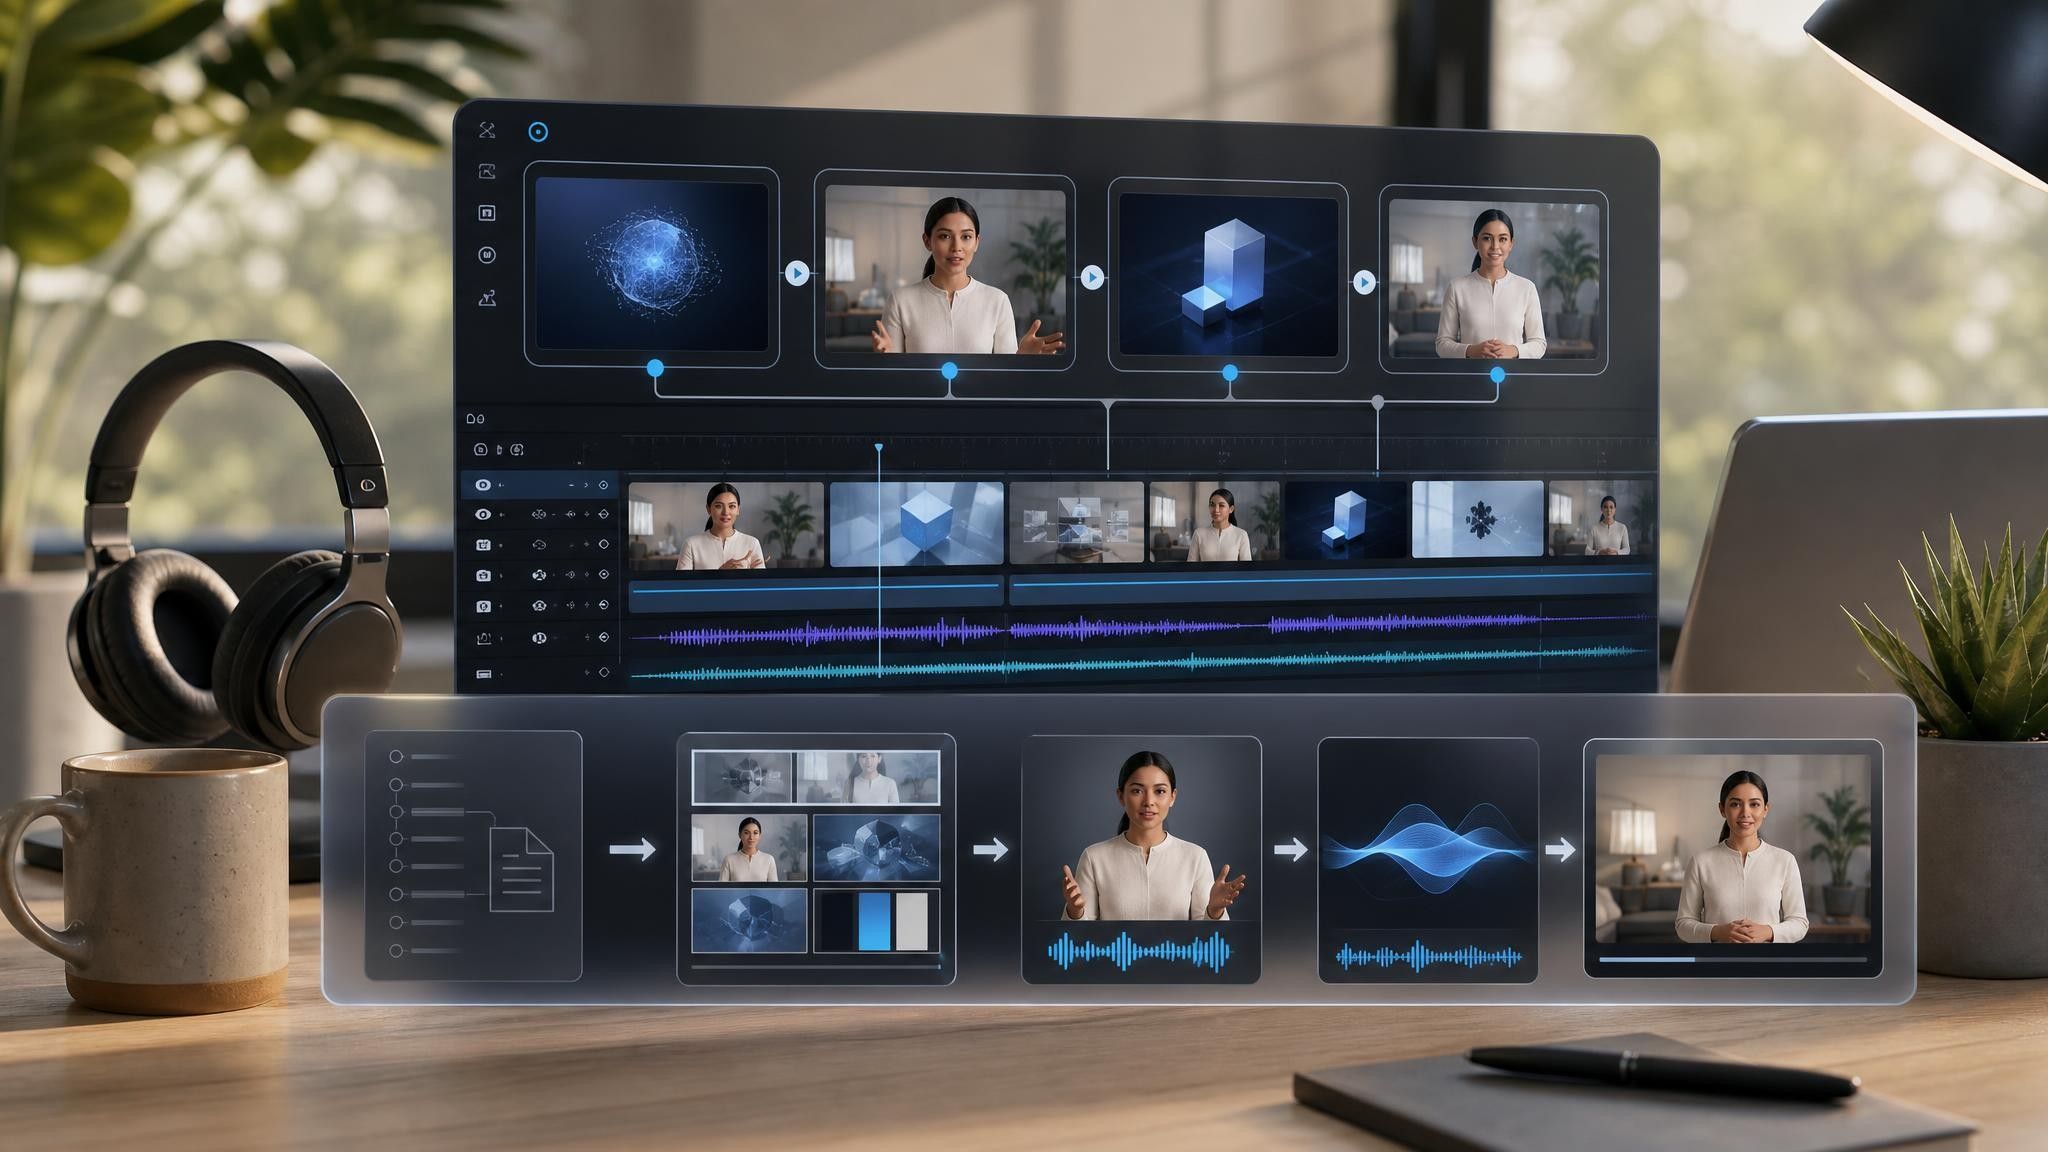
One finding makes a shareable clip. Five makes a report summary. Choose the template that matches, rather than fitting fifteen figures into one video.
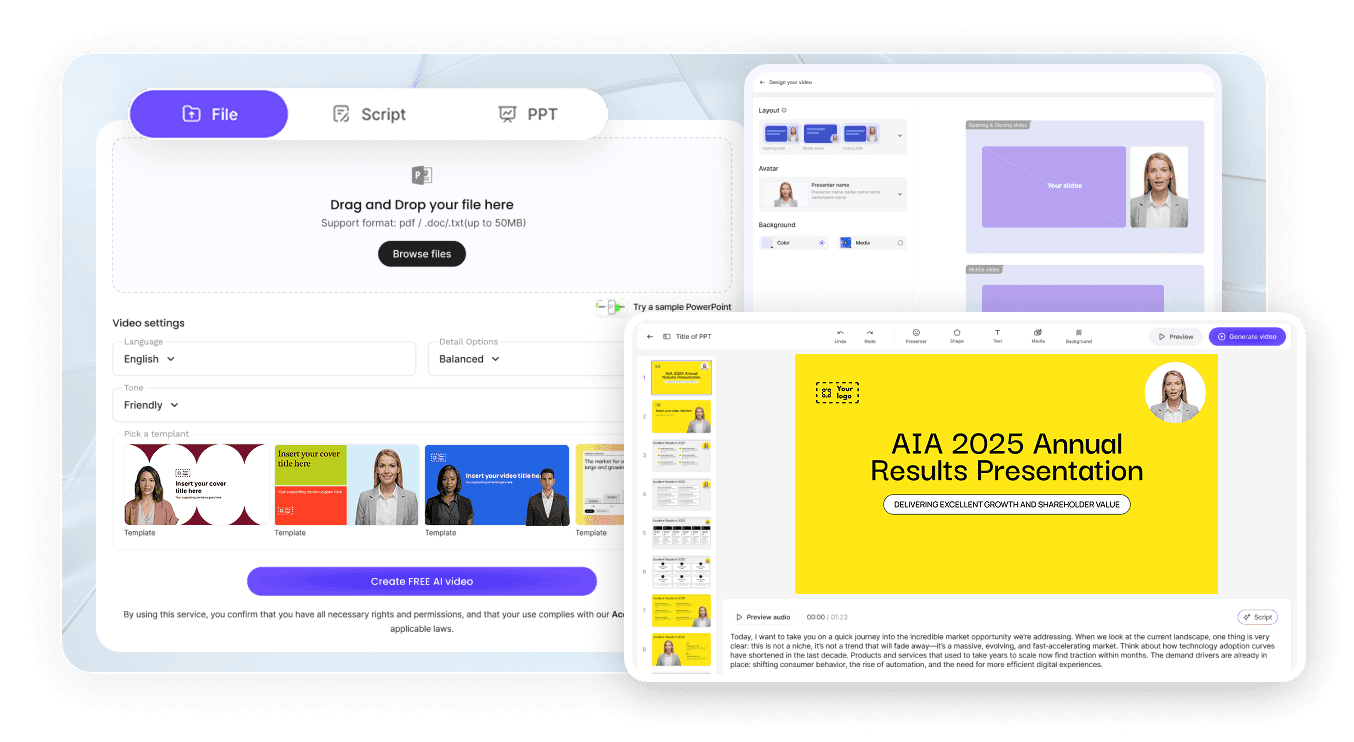
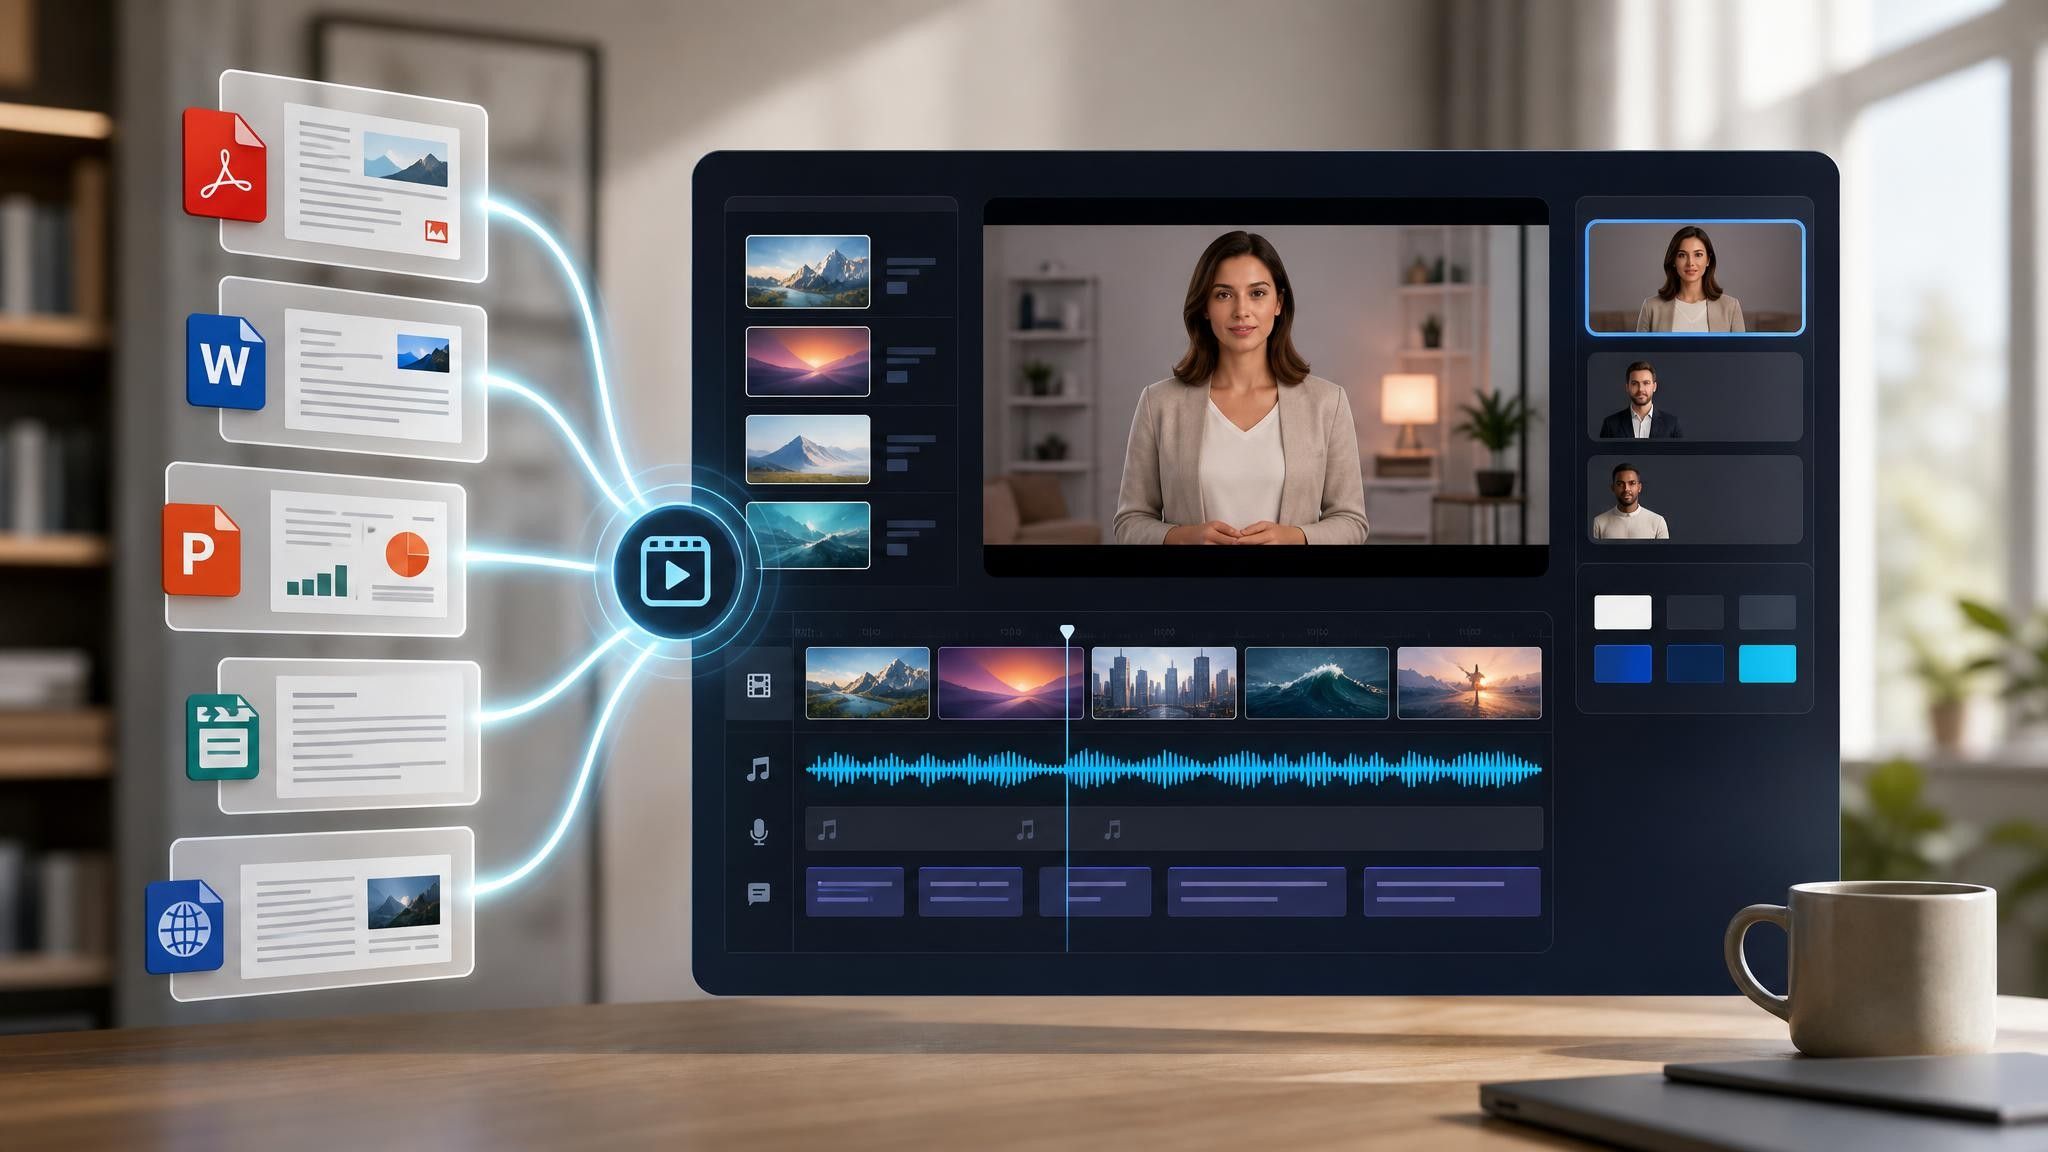
Add the report, survey export, or data summary as a PDF, DOCX, PPTX, or TXT file up to 200 MB.
This is the step that matters most on a data video. Check each number and label against the source, and correct the caption text directly in the scene.
Produce HD MP4 in 16:9 for the report landing page and 9:16 or 1:1 for the social cuts, from the same project.
Research teams publish a report, promote it for two weeks, and then watch it go quiet. An infographic video gives the same findings a second distribution window without new research, and the source document is unchanged.
You can turn:
An annual industry report into a highlights video for the download page
A customer survey into a findings video for the launch announcement
A benchmark study into a comparison video that positions your category
An internal metrics deck into a quarterly recap for the whole company
When next year's data arrives, replace the source file and regenerate the scenes rather than rebuilding the animation.
Research and content teams publish more findings than anyone reads. Below are the three moments where turning figures into video opens a distribution window the original document never gets.
Long reports get downloaded and never opened. Add a highlights video on the same page as the gated PDF.
One number travels further than a full report. Build a vertical clip around it and link back to the study.

Metric decks lose the room by slide four. Send a short data video before the meeting so the numbers land first.

Restraint. One idea per scene, the question stated before the figure appears, and no more than five findings in a single video. Videos that try to reproduce a full infographic on screen end up unreadable on a phone, which is where most of them are watched.
For social and campaign use, one. For a report summary, three to five. Past five, viewers stop retaining individual figures and remember only that there were a lot of them.
You can bring existing charts and visuals into the project by uploading them to My Media and placing them into scenes, and use the template's animated layouts for figures you enter as text.
Yes. The same project exports in 16:9, 1:1, and 9:16. For vertical cuts, reduce to a single finding per video rather than reformatting the full sequence.
Choose a template, upload the report you already published, and give its findings somewhere new to go.


Choose a template, add your existing content, and generate an editable video project.